This Metric Printed In 2017 Before Bitcoin Exploded: Is A Mega Run Incoming?
In a post on X, one analyst has a key on-chain metric that could signal the beginning of a strong leg up, similar to the explosive gains 2017. Currently, Bitcoin prices remain steady and edging higher. However, the coin failed to register sharp upswings, as most traders had predicted before the Halving event on April 20.
Flow Indicator Dips: A Bull Run In The Making?
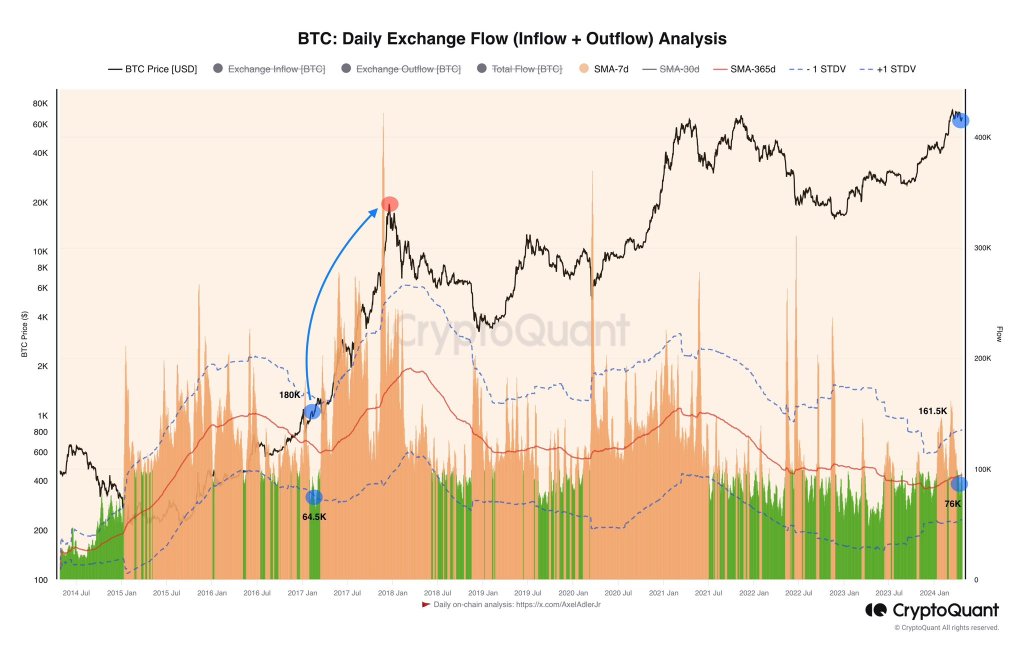
Taking to X, the analyst said there has been a sharp drop in the 7-day average Flow indicator at leading crypto exchanges like Coinbase and Binance. When this was highlighted, the Flow indicator pointed to a decline from 161,000 to 76,000 BTC, a nearly 50% drop.
Interestingly, a similar pattern emerged in 2017 before Bitcoin embarked on a historic bull run.
The analyst said the Flow indicator dropped to 64,500 BTC across exchanges days and weeks later before prices exploded to around $20,000 in December 2017.
For now, only time will tell if Bitcoin is preparing for a strong leg up. The coin remains within a bear formation, looking at the candlestick arrangement in the daily chart. Even though prices rose after Halving Day on April 20, sellers are in charge. As it is, the April 13 bearish engulfing pattern continues to define price action. Technically, a close above $68,000 might be the foundation for a rally towards $74,000 in the days ahead.
Bitcoin Supply Rapidly Shrinking
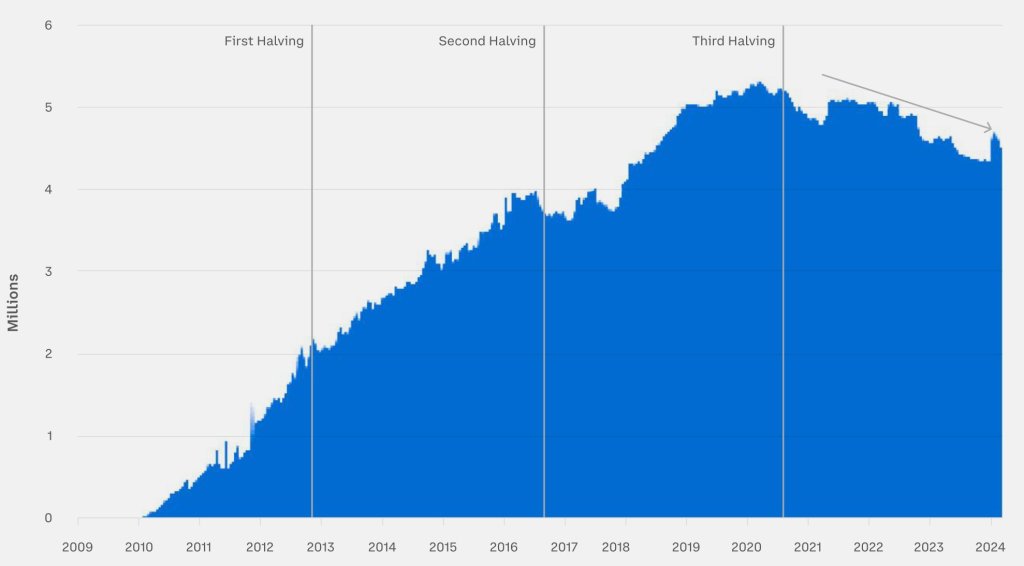
While the Flow indicator points to declining BTC across exchanges, another analyst has discovered an interesting development. Taking to X, another analyst that the available Bitcoin supply dipped below 4.6 million for the first time before April 20, when the network halved miner rewards.
Since Halving reduces daily emissions by half, even if the current demand is sustained, the analyst says a supply squeeze will drive prices higher. Even so, as mentioned earlier, whether BTC will rally depends on the pace at which immediate resistance levels are cleared.
Historically, prices tend to rally a few months after Day. However, in the past few months, there have been notable deviations. For instance, prices soared to all-time highs before Halving Day. This is the first time this has happened.
Beyond technical formations, the United States Securities and Exchange Commission (SEC) approved the first spot Bitcoin ETFs in January 2024. Through this product, institutions are free to gain exposure through shares. These shifting dynamics will shape price action in the current epoch, possibly leading to new deviations from historical performances.